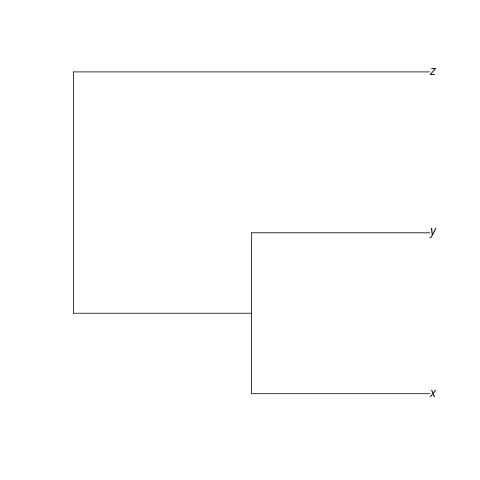
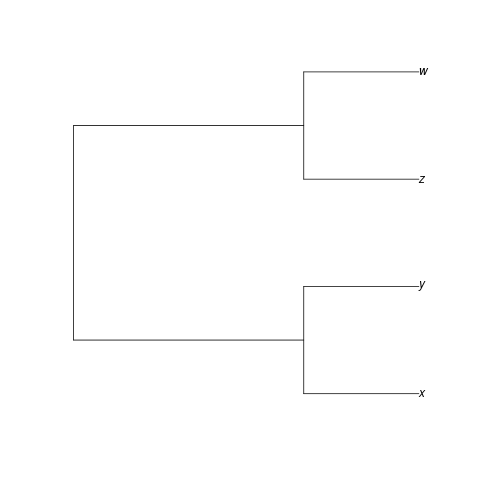
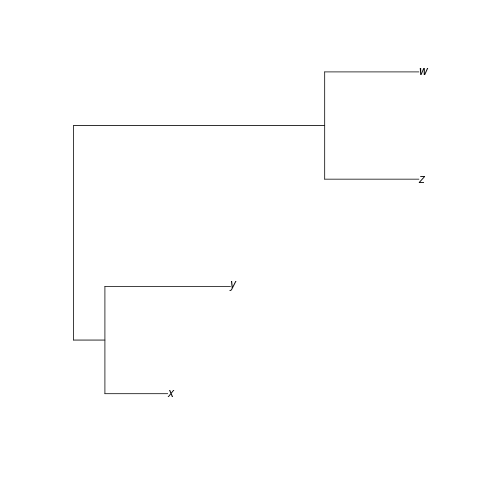
<style> ol.outline { list-style: none; padding-left: 0; } ol.outline li { opacity: 0.6; display: flex; align-items: center; } ol.outline li.active { opacity: 1; } ol.outline li::after { content: ""; font-size: 1em; margin-left: 0.25em; } ol.outline li.active::after { content: "←"; /* Right-pointing arrow */ } </style> ## Phylogenetics and molecular evolution --- ## Sources - [Adam Smith's lecture of Phylogenetic Trees](https://pages.cs.wisc.edu/~aasmith/biolec/trees.html) - [Bioinformatics and Molecular Evolution by Higgs and Attwood](https://onlinelibrary.wiley.com/doi/book/10.1002/9781118697078) - [Molecular Evolution: A Phylogenetic Approach, by Page and Holmes](https://www.wiley.com/en-sg/Molecular+Evolution%3A+A+Phylogenetic+Approach-p-9780865428898) --- ## Outline <ol class="outline"> <li>Historical background of molecular evolution</li> <li>Sequence distances and sequence evolution models</li> <li>Phylogenetics and tree building</li> </ol> --- ## Outline <ol class="outline"> <li class="active">Historical background of molecular evolution</li> <li>Sequence distances and sequence evolution models</li> <li>Phylogenetics and tree building</li> </ol> --- ## Review question Why might a reference genome mask the pseudoautosomal region (PAR) on chrY? --- What makes evolution molecular? --- Tree thinking (1837) and Origin of Species (1859) <img alt="Darwin's notebook" src="images/phylogenetics/darwin_notebook.jpg" style="max-height: 450px; float:left; padding:5px"/> <img alt="Darwin's notebook" src="images/phylogenetics/Origin_of_Species.svg" style="max-height: 450px; background-color: white; padding:5px; float:right"/> --- Brown et al (1955) [10.1042/bj0600556](https://doi.org/10.1042/bj0600556) <img alt="Insulin differences among species" src="images/phylogenetics/brown1955_summary.png" style="max-height: 320px;"/> Early evidence of species differ at the molecular level Contributed to Sanger's first Nobel prize in 1958 --- Sarich (1967): Molecular evidence of humans and apes <img alt="Albumin antiserum table" src="images/phylogenetics/sarich1967_table1.png" style="max-height: 300px;"/> <img alt="Proposed primate phylogeny" src="images/phylogenetics/sarich1967_fig1.png" style="max-height: 300px;" class="fragment"/> --- <img alt="DNA evidence" src="images/phylogenetics/wilson1969_abstract.png" style="max-height: 300px;"/> <img alt="Hemoglobin amino acid differences" src="images/phylogenetics/wilson1969_table1.png" style="max-height: 300px;"/> --- Shao et al. 2023, Science <10.1126/science.abn6919> <img alt="Primate Tree of Life" src="images/phylogenetics/shao2023_fig1.jpg" style="max-height: 600px;"/> --- Hug et al 2016, Nature Microbiology <img alt="Modern Tree of Life" src="images/phylogenetics/hug2016_fig2.jpg" style="max-height: 600px;"/> --- ## Outline <ol class="outline"> <li>Historical background of molecular evolution</li> <li class="active">Sequence distances and sequence evolution models</li> <li>Phylogenetics and tree building</li> </ol> --- Homology > Two characters are homologous if they are related by descent from a common ancestor <div class="fragment"> Consider this MSA (Multiple Sequence Alignment) ``` Species 1 AAGTTTCCA Species 2 AAA---CCA Species 3 GGA---CCA Species 4 AGA---CCA ``` </div> <div class="fragment">A MSA is a homology statement</div> --- ## Sequence distance How different are they? ```console ACCTGTAATC ACGTGCGATC * ** ``` <span class="fragment">Count the proportion of differences, $D=3/10$</span> --- ## Problems with $D$ <img src="images/phylogenetics/multiple-hits.svg" style="max-height: 250px; background-color: white;"/> <img src="images/phylogenetics/multiple-hits-2.svg" style="max-height: 250px; background-color: white;" class="fragment"> <img src="images/phylogenetics/multiple-hits-3.svg" style="max-height: 250px; background-color: white;" class="fragment"> <img src="images/phylogenetics/multiple-hits-4.svg" style="max-height: 250px; background-color: white;" class="fragment"> --- ## Problems with $D$ - multiple hits: the same character changes multiple times in the same lineage - homoplasy: the same character state arises independently in different lineages - $D$ does not increase linearly with time - $D$ is not additive --- Instead, imagine a distance $d$: the average number of substitutions that have ~~been observed~~ *occurred* per site $d$ increases linear with time (assuming random and constant mutation rate) $d$ is additive <span class="fragment">Unfortunately, $d$ is not observable. But can we calculate it from $D$?</span> --- ## Jukes-Cantor distance $$ d = -\frac{3}{4} \log\left(1 - \frac{4}{3}D\right) $$ --- ## Jukes-Cantor distance ```R D = seq(0, 0.75, by=0.01) jcdist = function(D) { -3/4 * log(1-(4/3)*D) } plot(D, jcdist(D), type="l", xlab="Observed proportion of differences", ylab="Jukes-Cantor d") ``` <div class="fragment"> <img alt="Jukes-Cantor distance" src="images/phylogenetics/jcdist.png" style="max-height: 450px; background-color: white;"/> </div> --- Models of sequence evolution Transition matrix $$ P_{X \rightarrow Y}(t) = \begin{bmatrix} p_{AA}(t) & p_{AC}(t) & p_{AG}(t) & p_{AT}(t) \\\\ p_{CA}(t) & p_{CC}(t) & p_{CG}(t) & p_{CT}(t) \\\\ p_{GA}(t) & p_{GC}(t) & p_{GG}(t) & p_{GT}(t) \\\\ p_{TA}(t) & p_{TC}(t) & p_{TG}(t) & p_{TT}(t) \end{bmatrix} $$ Equilibrium frequencies $$ \mathbf{\pi} = [\pi_A, \pi_C, \pi_G, \pi_T] $$ --- ## Jukes-Cantor Model (1969) $$ P_t = \begin{bmatrix} \cdot & \alpha & \alpha & \alpha \\\\ \alpha & \cdot & \alpha & \alpha \\\\ \alpha & \alpha & \cdot & \alpha \\\\ \alpha & \alpha & \alpha & \cdot \end{bmatrix} $$ $$ \mathbf{\pi} = [\pi_A=\frac{1}{4}, \pi_C=\frac{1}{4}, \pi_G=\frac{1}{4}, \pi_T=\frac{1}{4}] $$ <div class="fragment"> $$ d = -\frac{3}{4} \log\left(1 - \frac{4}{3}D\right) $$ </div> --- Are substitution rates equal? <div class="fragment"> <img alt="transitions vs transversions" src="images/phylogenetics/transitions.svg" style="max-height: 450px; background-color: white;"/> Which is more common, transitions or transversions? Source: wikipedia </div> --- ## Kimura 2-parameter model (1983) Parameterizes transitions and transversions separately $$ P_t = \begin{bmatrix} \cdot & \beta & \alpha & \beta \\\\ \beta & \cdot & \beta & \alpha \\\\ \alpha & \beta & \cdot & \beta \\\\ \beta & \alpha & \beta & \cdot \end{bmatrix} $$ $$ \mathbf{\pi} = [\pi_A=\frac{1}{4}, \pi_C=\frac{1}{4}, \pi_G=\frac{1}{4}, \pi_T=\frac{1}{4}] $$ <!-- $$ P_t = \begin{bmatrix}\begin{smallmatrix} \frac{1}{2}e^{-\frac{2}{3}t} + \frac{1}{2} & \frac{1}{4}e^{-\frac{2}{3}t} - \frac{1}{4} & \frac{1}{4}e^{-\frac{2}{3}t} - \frac{1}{4} & \frac{1}{4}e^{-\frac{2}{3}t} - \frac{1}{4} \\\\ \frac{1}{4}e^{-\frac{2}{3}t} - \frac{1}{4} & \frac{1}{2}e^{-\frac{2}{3}t} + \frac{1}{2} & \frac{1}{4}e^{-\frac{2}{3}t} - \frac{1}{4} & \frac{1}{4}e^{-\frac{2}{3}t} - \frac{1}{4} \\\\ \frac{1}{4}e^{-\frac{2}{3}t} - \frac{1}{4} & \frac{1}{4}e^{-\frac{2}{3}t} - \frac{1}{4} & \frac{1}{2}e^{-\frac{2}{3}t} + \frac{1}{2} & \frac{1}{4}e^{-\frac{2}{3}t} - \frac{1}{4} \\\\ \frac{1}{4}e^{-\frac{2}{3}t} - \frac{1}{4} & \frac{1}{4}e^{-\frac{2}{3}t} - \frac{1}{4} & \frac{1}{4}e^{-\frac{2}{3}t} - \frac{1}{4} & \frac{1}{2}e^{-\frac{2}{3}t} + \frac{1}{2} \end{smallmatrix}\end{bmatrix} $$ --> if $\alpha = \beta$, the K2P model = the Jukes-Cantor model --- ## K2P distance $$ D = D_{transitions} + D_{transversions} \\\\ D = S + V $$ $$ d = -\frac{1}{2} \ln\left(1 - 2S - V\right) - \frac{1}{4} \ln\left(1 - 2V\right) $$ --- Test your understanding ```console ACCTGTAATC ACGTGCGATC * ** ``` $D = $ <span class="fragment">3/10 </span> <span class="fragment">$d_{JC} = ... $ > or < D? </span><span class="fragment">0.38</span> <span class="fragment">$d_{K2P} = ...$ > or < D? $d_{JC}$ ? <span class="fragment">0.402</span> <span class="fragment">Key point: distance depends on the model</span> --- ## HKY model (1985) $$ \mathbf{\pi} = \sout{[0.25, 0.25, 0.25, 0.25]} $$ $$ \mathbf{\pi} = [\pi_A, \pi_C, \pi_G, \pi_T] $$ $$ P_t = \begin{bmatrix} \cdot & \alpha\pi_C & \beta\pi_G & \alpha\pi_T \\\\ \alpha\pi_A & \cdot & \beta\pi_G & \alpha\pi_T \\\\ \beta\pi_A & \alpha\pi_C & \cdot & \beta\pi_T \\\\ \alpha\pi_A & \beta\pi_C & \alpha\pi_G & \cdot \end{bmatrix} $$ --- ## GTR model (1990,1994) $$ P_t = \begin{bmatrix} \cdot & \alpha_{CA}\pi_C & \alpha_{GA}\pi_G & \alpha_{TA}\pi_T \\\\ \alpha_{CA}\pi_A & \cdot & \alpha_{GC}\pi_G & \alpha_{TC}\pi_T \\\\ \alpha_{GA}\pi_A & \alpha_{GC}\pi_C & \cdot & \alpha_{TG}\pi_T \\\\ \alpha_{TA}\pi_A & \alpha_{TC}\pi_C & \alpha_{TG}\pi_G & \cdot \end{bmatrix} $$ Time-reversible: $P_{ij}(t) = P_{ji}(t)$ --- So: which model should you use? --- How many parameters in each model? rate parameters + equilibrium frequencies: JC: 1 + 0 = 1 K2P: 2 + <span class="fragment">0 = 2</span> HKY: <span class="fragment">2 + 3 = 5</span> GTR: <span class="fragment">6 + 3 = 9</span> <span class="fragment"> Model testing: choose the simplest model that fits the data </span> --- ## Conclusion: Key points - Use a sequence evolution model to account for unobserved differences - Models of increasing complexity yield increasingly realistic distances - Models with increased complexity require more parameters --- ## Outline <ol class="outline"> <li>Historical background of molecular evolution</li> <li>Sequence distances and sequence evolution models</li> <li class="active">Phylogenetics and tree building</li> </ol> --- # Tree building - Distance-based methods - UPGMA - Neighbor-joining - Character-based methods - Parsimony - Maximum likelihood - Bayesian inference --- ### Two types of tree <div class="row"> <div class="col2"> Rooted <img src="images/phylogenetics/rooted-tree.svg" style="background-color: white; padding: 2px;"> </div> <div class="col2"> Unrooted <img src="images/phylogenetics/unrooted-tree.svg" style="background-color: white; padding: 2px;"> </div> </div> Rooted trees provide **direction**; unrooted trees only show relationships. --- ### What's the difference? <img src="images/phylogenetics/rootings-mobile.svg" style="background-color: white; padding: 2px;"> <div class="fragment">Are these trees rooted?</div> --- ### Can you root an unrooted tree? <img src="images/phylogenetics/rootings.svg" style="max-width:700px; background-color: white; padding: 2px;"> --- ### Can you root an unrooted tree? <img src="images/phylogenetics/outgroup.svg" style="max-width:700px; background-color: white; padding: 2px;"> An outgroup is a species known to be outside the group of interest. The root must be between the outgroup and the ingroup. --- ### Are these the same tree? Example 1 <img src="images/phylogenetics/rooted-tree-mobile.svg" style="background-color: white; padding: 2px;"> --- ### Are these the same tree? Example 2 <img src="images/phylogenetics/rooted-tree-mobile-4.svg" style="background-color: white; padding: 2px;"> --- ### Are these the same tree? Example 3 <img src="images/phylogenetics/rooted-tree-mobile-2.svg" style="background-color: white; padding: 2px;"> --- ### Are these the same tree? Example 4 <img src="images/phylogenetics/rooted-tree-mobile-3.svg" style="background-color: white; padding: 2px;"> --- ## Tree building ### For a given MSA ### How can we find the optimal tree? --- Recall: What is homology? <div class="fragment"> > Two characters are homologous if they are related by descent from a common ancestor </div> <div class="fragment"> A MSA is a homology statement ``` Species 1 AAGTTTCCA Species 2 AAA---CCA Species 3 GGA---CCA Species 4 AGA---CCA ``` </div> --- ## Tree building ### For a given MSA ### How can we find the optimal tree? <div class="fragment"> Brute force? 1. Enumerate all possible trees 2. Calculate the score for each tree 3. Choose the tree with the best score </div> --- # How many trees? [Felsenstein 1978](https://doi.org/10.2307/2412810) $$ T = \prod_{k=2}^{n} (2k-3) $$ $$ = \frac{(2n-3)!}{(n-2)!2^{n-2}} $$ ```R possibleTrees = function(ntaxa) { factorial(2*ntaxa-3) / (factorial(ntaxa-2) * 2^(ntaxa-2)) } ``` --- # How many trees? <img src="images/phylogenetics/felsenstein1978_table1.png" style="max-height: 550px;"/> --- # Distance-based methods 1. Compute distances between all pairs of sequences 2. Build a tree based on a distance matrix --- UPGMA: Unweighted Pair Group Method with Arithmetic Mean 1. Start with a distance matrix 2. Find the closest pair of sequences 3. Join them with a new node 4. Compute the distances for the new node by averaging the distances to the other nodes 5. Repeat until all sequences are joined --- Merging nearest neighbors <img src="images/phylogenetics/joining.svg" style="max-height: 550px; background-color: white;"/> --- The UPGMA tree is guaranteed to be correct *if the data are ultrametric*. ultrametric means: - the distance from any two tips to their MRCA is the same - equivalently, for any 3 species on an ultrametric tree, the two largest distances will be equal <div class="fragment"> if sequences evolve at a constant rate, the data will be approximately ultrametric </div> --- Problems with UPGMA assumes a molecular clock -- that the rate of evolution is constant across the tree <div class="fragment"> In reality, the rate of evolution is not constant because selection varies: - among lineages - among types of genes - among genes in an organism - among sites in a gene </div> --- Problems with UPGMA Also: <img src="images/phylogenetics/tree-which.svg" style="max-height: 450px; background-color: white;"/> Say this is the real tree. UPGMA would join AB instead of AC. --- Neighbor-joining (Saitou and Nei 1987) <div class="fragment"> In UPGMA, the pair-to-merge is the one with the minimum $d(i,j)$. </div> <div class="fragment"> In NJ, we also build a tree by iteratively joining nodes, but the pair-to-merge is the one that minimizes $Q$: $$ \small Q(i,j) = (n-2)d(i,j) - \sum_k d(i,k) - \sum_k d(j,k) $$ $n$ is the number of current taxa. $k$ sums over all other taxa </div> --- $$ \small Q(i,j) = (n-2)d(i,j) - \sum_k d(i,k) - \sum_k d(j,k) $$ The NJ approach prefers to merge pairs that are not only close to each other but also minimize their total divergence from the rest of the tree. --- The NJ tree is guaranteed to be correct *if the data are additive*. additive means: - the distance between any two tips is the sum of the branch lengths between them - ultrametric data is additive, but not vice versa - additivity is thus a weaker assumption --- Problems with distance-based methods - they are greedy - they consider only distances, not actual sequences - they rely on restrictive assumptions not typically met in real data (ultrametricity or additivity) - they don't consider the possibility of multiple trees with the same score --- Character-based methods - Parsimony - Maximum likelihood - Bayesian inference --- # Parsimony Choose the tree that requires the fewest evolutionary changes --- Consider this MSA (Multiple Sequence Alignment) ``` Species 1 AAG Species 2 AAA Species 3 GGA Species 4 AGA ``` <div class="fragment"> Which tree is more parsimonious? <img src="images/phylogenetics/parsimony-seq-1.svg" style="max-height: 450px; background-color: white;"/> </div> --- Consider this MSA (Multiple Sequence Alignment) ``` Species 1 AAG Species 2 AAA Species 3 GGA Species 4 AGA ``` <div> Which tree is more parsimonious? <img src="images/phylogenetics/parsimony-seq-2.svg" style="max-height: 450px; background-color: white;"/> </div> --- Algorithms: - Scoring parismony: Fitch (1971) [Toward Defining the Course of Evolution: Minimum Change for a Specific Tree Topology](https://doi.org/10.1093/sysbio/20.4.406) - Weighted parsimony: see Sankoff (1975) [Minimal Mutation Trees of Sequences](https://doi.org/10.1137/0128004) --- Summary of parsimony criterion: - considers sequences themselves, not just distances - requires a tree search - slower than distance methods - simple, straightforward, logical - lacks a model; suitable for morphological data - faster than likelihood methods --- Also: Parsimony is sensitive to long-branch attraction <img src="images/phylogenetics/tree-which.svg" style="max-height: 450px; background-color: white;"/> --- # Maximum likelihood What is the most likely tree? Given: model of sequence evolution, tree, sequences Compute: the likelihood of the tree given the data --- Computing the likelihood of the data on a tree <img src="images/phylogenetics/ml-tree.svg" style="max-height: 350px; background-color: white;"/> What is the most likely state at position X? Y? --- <img src="images/phylogenetics/ml-tree.svg" style="max-height: 350px; background-color: white;"/> $$ L(X) = P_{X \rightarrow T}(t_1) \times P_{X \rightarrow C}(t_2) $$ $$ L(X=C) = P_{C \rightarrow T}(t_1) \times P_{C \rightarrow C}(t_2) $$ --- <img src="images/phylogenetics/ml-tree.svg" style="max-height: 250px; background-color: white;"/> $$ L(Y) = P_{Y \rightarrow C}(t_4) \times \sum_{X}^{X \in TCGA}{L(X)P_{Y \rightarrow X}(t_3)} $$ --- Finally, at the root, for each site $n$, $$ L_{n} = \sum_{Y}^{Y \in TCGA}{L(Y) \times \pi_{Y}} $$ <div class="fragment"> Likelihoods are multiplied across all sites: $$ L_{total} = \sum_{n}{ln (L_{n})} $$ </div> --- Summary of Maximum likelihood criterion: - More computationally intensive than Parsimony - Requires a model of sequence evolution - Requires a tree-search - More robust to long-branch attraction --- Tree confidence All methods considered so far yield a *point estimate*: a single tree. They do not provide a measure of confidence. --- Order of operations for phylogenetics 1. Identify orthologs 2. Align sequences (homology statements) 3. Build a tree --- Multiple alignment with fast-fourier transform (MAFFT) See <https://mafft.cbrc.jp/alignment/software/algorithms/algorithms.html> --- ## File formats --- FASTA format: raw sequences ```console >sequence1 tgcatgactgctagctatgcatgcatacggcatatagc >sequence2 tgcacgcactgctagctatgcaggcatacggcatatagc >sequence3 tgcatgactgctagctatgcatgcataccatatagc ``` --- FASTA format: aligned sequences ```console mafft dummy.fasta > dummy_aligned.fasta ``` ```console >sequence1 tgcatg-actgctagctatgcatgcatacggcatatagc >sequence2 tgcacgcactgctagctatgcaggcatacggcatatagc >sequence3 tgcatg-actgctagctatgcatgcatac--catatagc --- CLUSTAL format ```console mafft --clustalout dummy.fasta > dummy_aligned.clustal ``` ```console CLUSTAL format alignment by MAFFT FFT-NS-2 (v7.520) sequence1 tgcatg-actgctagctatgcatgcatacggcatatagc sequence2 tgcacgcactgctagctatgcaggcatacggcatatagc sequence3 tgcatg-actgctagctatgcatgcatac--catatagc ****.* *************** ****** ******** ``` --- ## NEXUS format ``` #NEXUS BEGIN DATA; DIMENSIONS NTAX=3 NCHAR=39; FORMAT DATATYPE=DNA MISSING=? GAP=-; MATRIX sequence1 tgcatg-actgctagctatgcatgcatacggcatatagc sequence2 tgcacgcactgctagctatgcaggcatacggcatatagc sequence3 tgcatg-actgctagctatgcatgcatac--catatagc ; END; ``` --- ## PHYLIP format ``` 3 39 sequence1 tgcatg-actgctagctatgcatgcatacggcatatagc sequence2 tgcacgcactgctagctatgcaggcatacggcatatagc sequence3 tgcatg-actgctagctatgcatgcatac--catatagc ``` --- ## Newick (parenthetic) format ```console ((x,y),z); ``` ```console ((x,y),(z,w)); ``` --- Plot trees in R with the `ape` package ```R plot(ape::read.tree(text="((x,y),z));")) ```  --- Nested groups ```R plot(ape::read.tree(text="((x,y),(z,w));")) ```  --- Branch lengths ```R plot(ape::read.tree(text="((x:0.2,y:0.4):0.1,(z:0.3,w:0.3):0.8);")) ```  --- How to use IQ-TREE ``` # Infer maximum-likelihood tree with auto-selected model iqtree -s example.phy # Find best-fit model only iqtree -s example.phy -m MF # Parallel processing iqtree -s example.phy -nt 4 ``` --- # SLURM ```bash #!/bin/bash #SBATCH --job-name=mafft #SBATCH --output=mafft.out #SBATCH --error=mafft.err #SBATCH --time=1:00:00 #SBATCH --ntasks=1 #SBATCH --cpus-per-task=1 #SBATCH --mem-per-cpu=1G #SBATCH --partition=cobi mafft --auto input.fasta > output.fasta ``` ```bash sbatch slurm_script.sh ``` <!-- --- Basic HPC --> <!-- --- # Deriving Jukes-Cantor distance --> <!-- - Database of 16S sequences: https://www.ncbi.nlm.nih.gov/nuccore - MAFFT aligner software: https://mafft.cbrc.jp/alignment/software/linux.html -->